File Analysis
The File Info Window contains four tabs:
Statistics
Statistics - All Columns
Statistics - Selected Cells
Statistics - Selected Cells by Columns
Statistics - Selected Columns
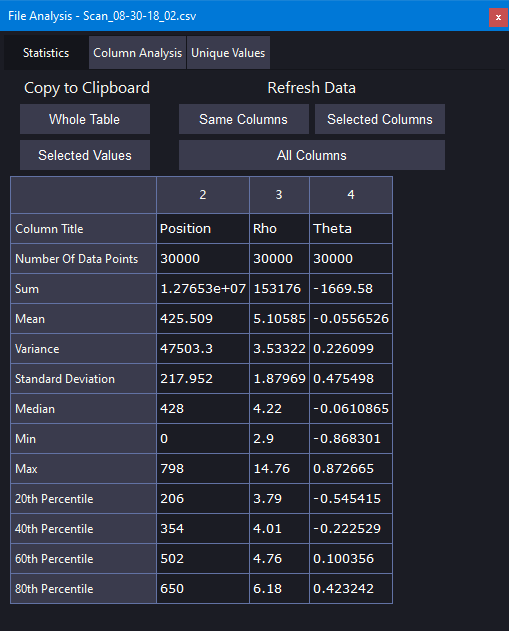
If your file contains numerical data, the Statistics tab will compute basic statistical measures. This includes:
- Number Of Data Points
- Sum
- Mean
- Variance
- Standard Deviation
- Median
- Min
- Max
- 20th Percentile
- 40th Percentile
- 60th Percentile
- 80th Percentile
Note that variance and standard deviations are biased.
The Statistics - Selected Cells command operates on all selected cells containing numerical values regardless of which column they're in. The Statistics - Selected Cells by Columns command segregates the selected cells by column and evaluates them.
Buttons
You can copy part or all of the results to the clipboard using the Whole Table or Selected Values buttons.
The measures will not update automatically if the underlying data is changed. You can tell it to update the same columns that you originally had it analyze with the Same Columns button. If you want it to update new columns, you can select them and click the Selected Columns button. If you want to analyze all columns, select the All Columns button.
Column Attributes
Column Attributes - All Columns
Column Attributes - Selected Columns
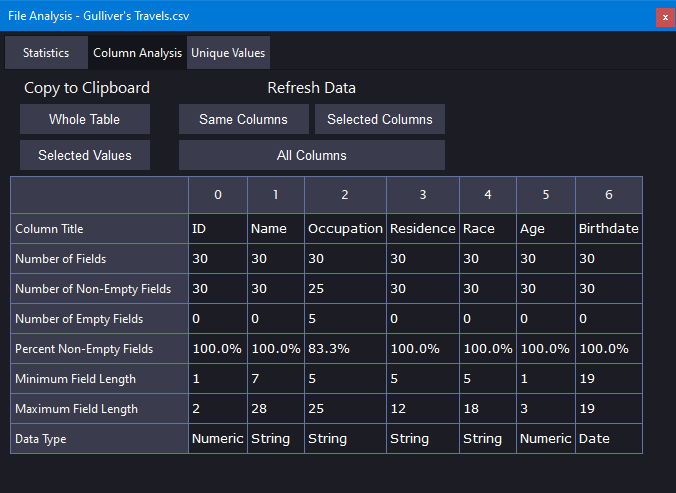
The Column Attributes tab gives you the following information about each column:
- Number of Fields
- Number of Non-Empty Fields
- Number of Empty Fields
- Percent Non-Empty Fields
- Minimum Field Length
- Maximum Field Length
- Data Type (String, Number, or Date)
Dates can be in virtually any format and it will detect them.
Buttons
You can also copy part or all of the results to the clipboard using the Whole Table or Selected Values buttons.
Like the Statistics tab, these values will not update automatically if the underlying data is changed. You can tell it to update the same columns that you originally had it analyze with the Same Columns button. If you want it to update new columns, you can select them and click the Selected Columns button. If you want to analyze all columns, select the All Columns button.
Unique Values
Unique Values - Selected Column
Select Values in Selected Column to Filter
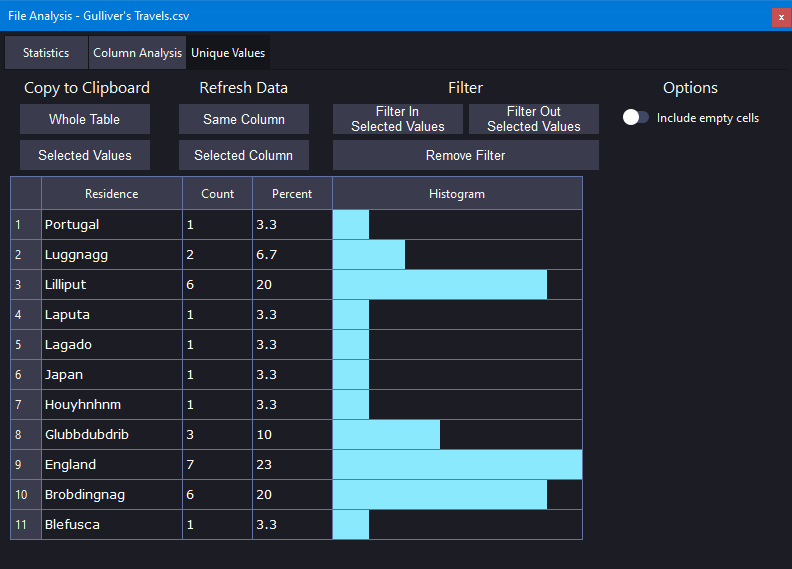
The Unique Values tab tells you how many times each distinct value in a column appears and the percentage of entries in the column it occupies. It also provides a histogram to graphically compare the number of appearances of the various values.
It can also be used to pick distinct values to filter. You can either filter them in (i.e. view only rows with selected values) or filter out them (i.e. view all rows except those with the selected values).
Buttons
You can copy part or all of the results to the clipboard using the Whole Table or Selected Values buttons.
Like the other two tabs, the values will not update automatically if the underlying data is changed. You can tell it to update the data with the Same Column button. If you want data on a diffent column, select it in the main window and click the Selected Column button.
To filter values, select whichever value or values you want (it doesn't have to be the value column. You can select the Count or Percent column). Click the Selected Values In or Selected Values Out button to filter the values in or out.
Pivot Table
Pivot Table - Selected Columns
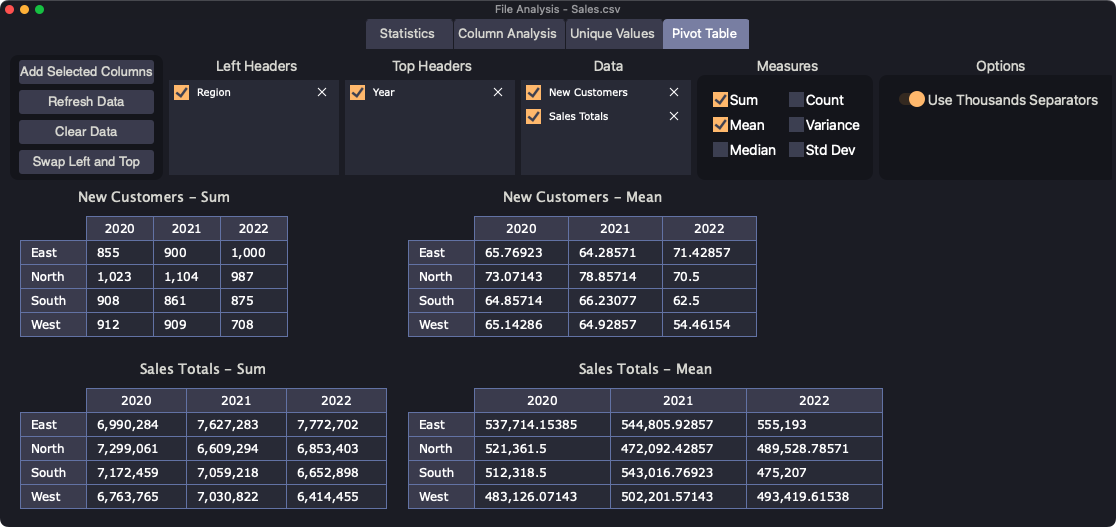
The Pivot Table shows statistics on groups of data. For instance, if you have sales data for salesmen grouped into regions North, East, South, and West, the Pivot Table can show you the grand total for each region or the average of each salesman in each region.
You'll need to provide it two types of data - headers and data. The headers are the groups (e.g. North, East, South, and West) and the data are numerical values to operate on (e.g. sales figures). There is no limit to how many header columns or data columns you can use. Header columns can go on the left of the pivot table or along the top. You can place header columns on the left axis or along the top and order them however you want.
To use it, select columns representing both the headers and the data and call the Pivot Table - Selected Columns command. It will place all non-numerical data in the Left Headers list and all numerical data in the Data list. You're free to move them around as you wish by simply dragging and dropping. For instance, if there's a year column, it'll start in the Data list, but you'll probably want it to be under one of the Header lists.
You can select as many statistical measures as you like. The options are:
- Sum
- Mean
- Median
- Count
- Variance
- Standard Deviation
If you want to remove a column from the Left Headers, Top Headers, or Data lists, click on the X symbol to the right. If you want to temporarily hide it, uncheck the box to the left.
Buttons
If you want to pull more columns into the Pivot Table, select them on the original file and then click the Add Selected Columns button. If the underlying data is changed, you can update the tables with the Refresh Data button. To remove all columns, click the Clear Data button. If you want to transpose the table, the Swap Left and Top button will do that.
If you want to copy and entire table to the clipboard, including headers and data, right click and select the Copy Entire Table option. You can also copy individual values.